Introduction
In our customer portal Azets Work we have about 6,300 managers approving roughly 55,000 time reports every month. Often managers are very busy – and to be honest, approving time reports is not the most exciting part of the work – so understandably there are faulty reports being approved every now and then. Often our payroll consultants notice these errors, but sometimes that’s not possible and the error might not be noticed until after the (potentially) incorrect salary has been paid, or not at all.
This article is about how we investigated if we could utilize AI to support these managers in making better decisions, in a faster and easier way.
Anomaly detection
The idea was to notify approving managers if a specific time report had any anomalies in it. We decided to focus on reported presence (worked hours, overtime, etc.), hence we didn’t consider reported absence (sick leave, vacation, paternity leave, etc.) this time. We have roughly 3 million reported presence events in Azets Work’s time reporting application, but unfortunately we couldn’t use reinforced learning methods as we don’t have any training data – we only have approved presence events in the database so we can’t explain what’s wrong and what’s correct.
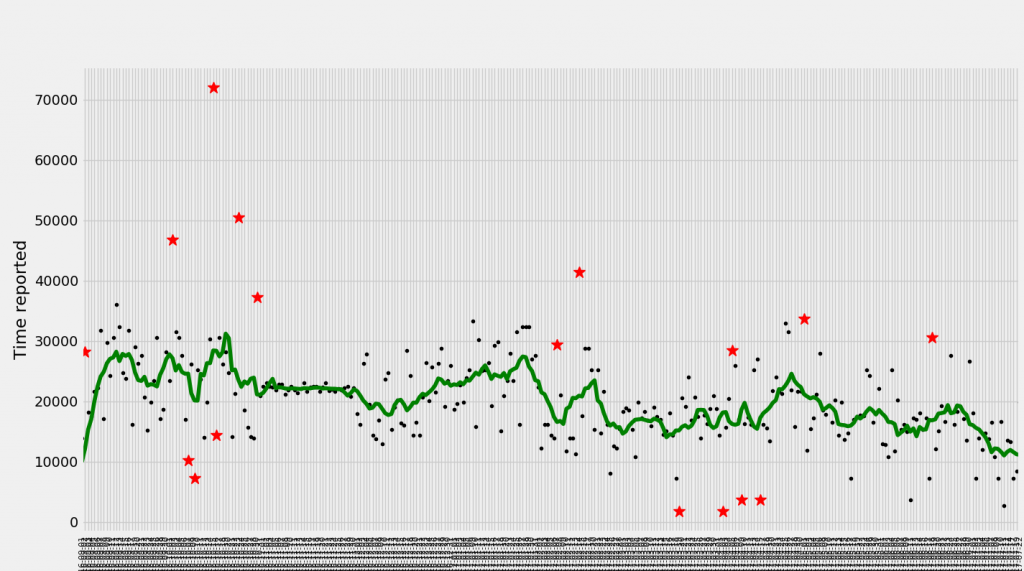
At first, the idea was to get all last year presence events for all users in all companies and plot them on time-series ordered by date, as they seem to be ordinary time-series events. Ordinary anomaly detection algorithms for time-series include moving average calculations and distribution of the residual. In the picture below, you can see black dots – presence events for last year, green line – moving average, red stars – potential anomalies.
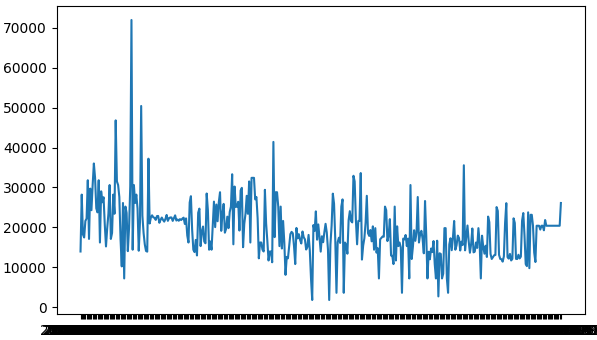
The second idea was to use ARIMA (Autoregressive Integrated Moving Average), which should take into account seasonality as well. After applying SARIMAX model from statsmodels it was clear that generated time-series with current data were too random with no trend, and the variation for anomaly errors were too big.
After this approach, it seemed logical to move to other methods for anomaly detection as it seemed that our data was not suitable for time-series methods. Another widely used method is clustering – the task of grouping a set of objects in such a way that objects in the same group (called a cluster) are more similar (in some sense or another) to each other than to those in other groups (clusters). Creating clusters seemed pretty straightforward and after some experimentation, we got 11 clusters. In the image below we have day_of_year/365 on X-axis and time reported in seconds on Y-axis.
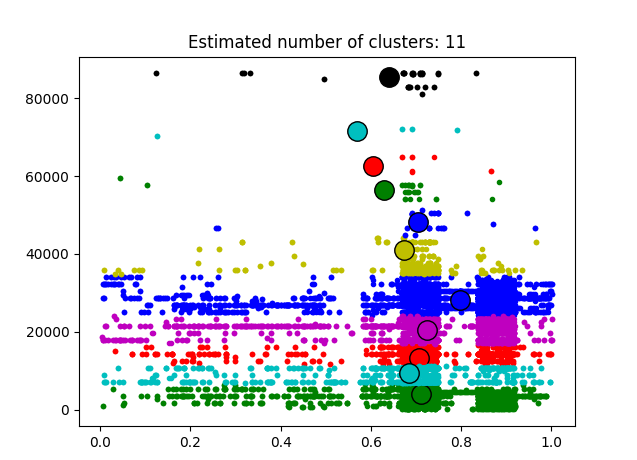
From this clustering, we can see that most of the presence events are reported at the end of the summer/beginning of the fall and it estimated the center of the clusters in those months. All clusters seemed elliptical and based on reported time, which didn’t mean anything from anomaly detection point of view. With more research we stumbled upon outlier detection algorithms in scikit library for Python. And at this point we were up for pretty much everything so we treid out “One-class SVM with non-linear kernel” method without actually knowing what it does.
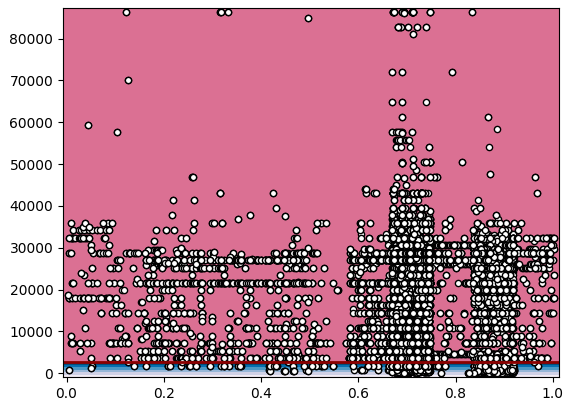
With this method, anything outside the red line (outside the red zone, or near it) was classified as an anomaly. This didn’t seem right as this meant that all small presence events are anomalies.
After a weekend of thinking on how to approach this problem, our lead developer on the project had an “aha moment” – what if we’re using too much data? What if we can’t base single user behavior on all users we have from different countries, who uses our system differently? Maybe we should detect if the users acts abnormally compared to his previously reported presence and not compared to all other users. And since users won’t have so many presence events maybe it’s better to anomalies for monthly or weekly data.
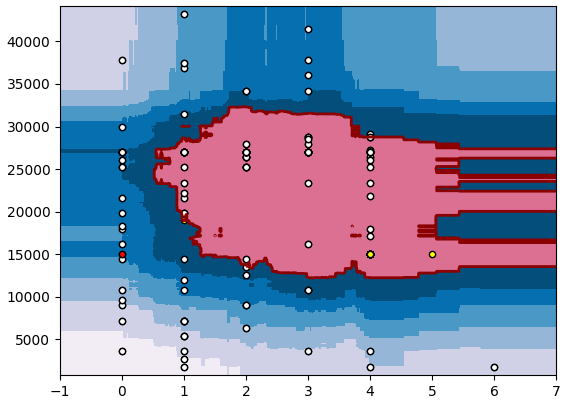
With this realization, we extracted all single users’ presence events for the past year, and after some time playing around with different algorithms from sklearn (we used EllipticEnvelope, OneClassSVM and IsolationForest) and different parameters we were able to see some interesting trends. We decided to look at user behavior on weekly basis, as this seemed more natural for user working hours (compared to monthly or yearly presences).
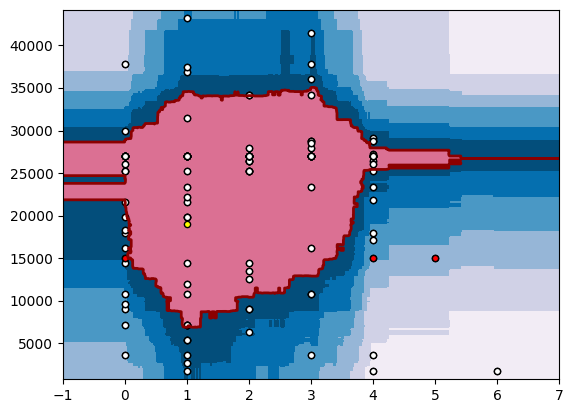
In this plot, we can see that most commonly reported presence events are in the red zone. This model is easily and quickly trained on existing data, and thus can be created on demand. If we want to predict if the user created events for the period (let’s say 15000s on Monday, 19000s on Tuesday, 15000s on Friday and 15000s on Saturday, as we did here – red and yellow dots), we can easily see that 3 out of 4 events can be considered as an anomalies. However, if the user starts reporting presence events on Friday casually, this model can be shifted and those events will be considered as normal behavior: